
Wednesday, May 23, 2018 From rOpenSci (https://deploy-preview-991--ropensci.netlify.app/blog/2018/05/23/taxize-seven-years/). Except where otherwise noted, content on this site is licensed under the CC-BY license.
taxize was seven years old this last Saturday!
🔗 What is taxize?
taxize is designed around making working with taxonomic names easier - abstracting away the details of what each of 20 or so taxonomic data sources require for a given use case.
A samping of use cases covered in taxize (all of these across many different data sources):
- Taxonomic identifier from a taxonomic name and vice versa
- Taxonomic name from a vernacular (common) name and vice versa
- Taxonomic hierarchy/classification from identifier or name
- Taxonomic children of an identifier or name
- All taxa downstream to a certain rank from identifier or name
- Taxonomic name synonyms from identifier or name
- Lowest common taxon and rank for an identifier or name
- Resolve taxonomic names, i.e., fix spelling errors
🔗 History
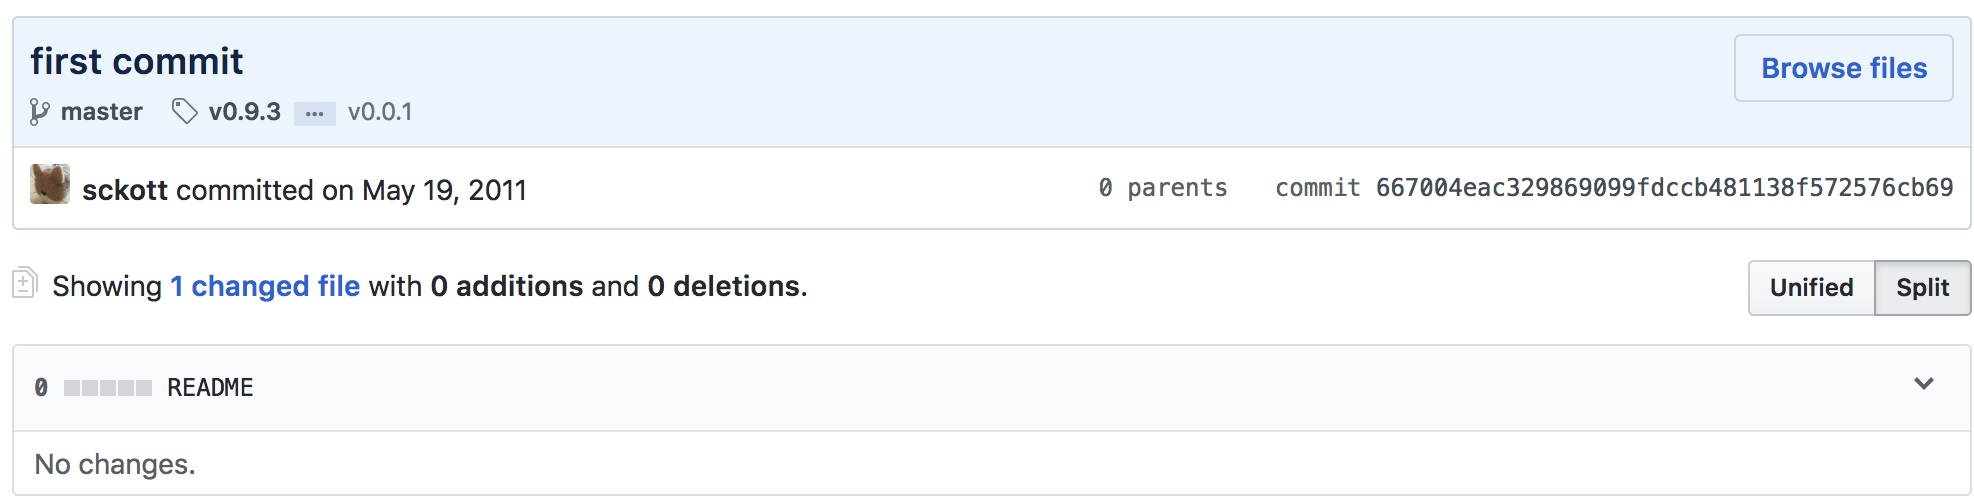
taxize was one of our first packages. Our first commit was on 2011-05-19, uneventfully adding an empty README:
We’ve come a long way since May 2011. We’ve added a lot of new functionality and many new contributors.
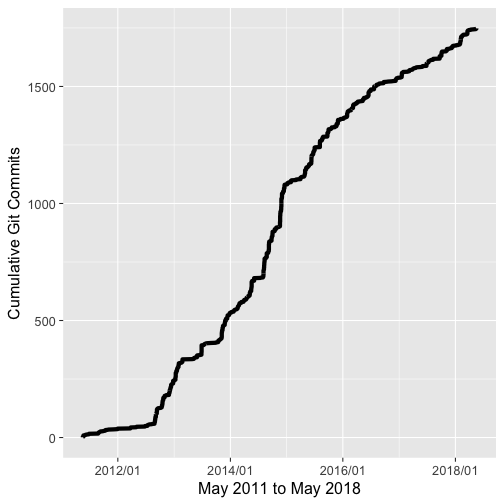
🔗 Commit history
Get git commits for taxize using a few tidyverse packages as well as git2r, our R package for working with git repositories:
library(git2r)
library(ggplot2)
library(dplyr)

repo <- git2r::repository("~/github/ropensci/taxize")
res <- commits(repo)
A graph of commit history
dates <- vapply(res, function(z) {
    as.character(as.POSIXct(z@author@when@time, origin = "1970-01-01"))
}, character(1))
df <- tbl_df(data.frame(date = dates, stringsAsFactors = FALSE)) %>%
    group_by(date) %>%
    summarise(count = n()) %>%
    mutate(cumsum = cumsum(count)) %>%
    ungroup()
ggplot(df, aes(x = as.Date(date), y = cumsum)) +
    geom_line(size = 2) +
    theme_grey(base_size = 16) +
    scale_x_date(labels = scales::date_format("%Y/%m")) +
    labs(x = 'May 2011 to May 2018', y = 'Cumulative Git Commits')
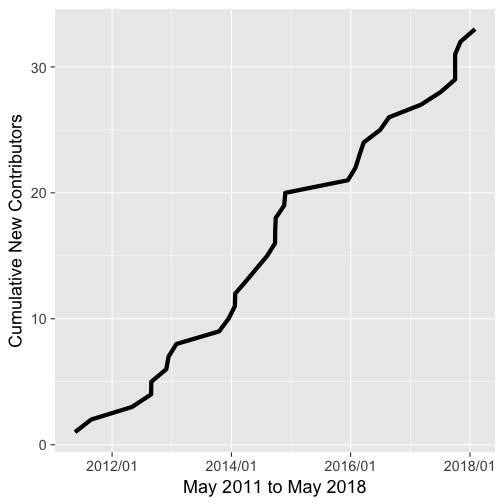
🔗 Contributors
A graph of new contributors through time
date_name <- lapply(res, function(z) {
    data_frame(
        date = as.character(as.POSIXct(z@author@when@time, origin = "1970-01-01")),
        name = z@author@name
    )
})
date_name <- bind_rows(date_name)

firstdates <- date_name %>%
    group_by(name) %>%
    arrange(date) %>%
    filter(rank(date, ties.method = "first") == 1) %>%
    ungroup() %>%
    mutate(count = 1) %>%
    arrange(date) %>%
    mutate(cumsum = cumsum(count))

## plot
ggplot(firstdates, aes(as.Date(date), cumsum)) +
  geom_line(size = 2) +
  theme_grey(base_size = 18) +
  scale_x_date(labels = scales::date_format("%Y/%m")) +
  labs(x = 'May 2011 to May 2018', y = 'Cumulative New Contributors')
taxize contributors, including those that have opened issues (click to go to their GitHub profile):
afkoeppel - ahhurlbert - albnd - Alectoria - andzandz11 - antagomir - arendsee - ashenkin - ashiklom - bomeara - bw4sz - cboettig - cdeterman - ChrKoenig - chuckrp - clarson2191 - claudenozeres - cmzambranat - daattali - DanielGMead - davharris - davidvilanova - diogoprov - dlebauer - dlenz1 - dschlaep - EDiLD - emhart - fdschneider - fgabriel1891 - fmichonneau - gedankenstuecke - gimoya - GISKid - git-og - glaroc - gustavobio - ibartomeus - jangorecki - jarioksa - jebyrnes - johnbaums - jonmcalder - JoStaerk - jsgosnell - kamapu - karthik - KevCaz - kgturner - kmeverson - Koalha - ljvillanueva - Markus2015 - mcsiple - MikkoVihtakari - millerjef - miriamgrace - mpnelsen - MUSEZOOLVERT - nate-d-olson - nmatzke - npch - paternogbc - philippi - pmarchand1 - pssguy - RodgerG - rossmounce - sariya - scelmendorf - sckott - SimonGoring - snsheth - snubian - Squiercg - tdjames1 - tmkurobe - tpaulson1 - tpoisot - vijaybarve - wcornwell - willpearse - wpetry - zachary-foster
🔗 taxize usage
Eduard Szöcs and I wrote a paper describing taxize back in 2013, published in F1000Research.
Scott Chamberlain and Eduard Szöcs (2013). taxize - taxonomic search and retrieval in R. F1000Research 2:191. https://doi.org/10.12688/f1000research.2-191.v1
The paper has probably made taxize users more likely to cite the package, though we have no direct proof of that.
The paper above and/or the package have been cited 69 times over the past 7 years.
The way taxize is used in research is often in “cleaning” taxonomic names in one way or another. In addition, many users use taxize to get taxonomic names for certain groups of interest.
One example comes from the paper
Weber, M. G., Porturas, L. D., & Taylor, S. A. (2016). Foliar nectar enhances plant–mite mutualisms: the effect of leaf sugar on the control of powdery mildew by domatia-inhabiting mites. Annals of Botany, 118(3), 459–466. doi:10.1093/aob/mcw118
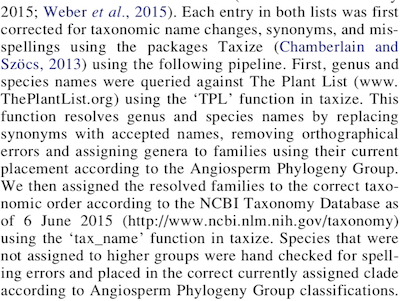
taxize methods example
🔗 Features coming down the road
- Integration with taxa package (maintained by one of our rOpenSci fellows Zachary Foster) in all
get_*()functions. This will make the outputs of allget_*()more consistent and easier to integrate into your downstream workflows. - not taxize per se, but taxizedb is starting to really take shape due to help from Zebulun Arendsee.
taxizedbwill make taxonomic name work much faster for large datasets. It’s worth checking out.
🔗 Thanks!
A huge thanks goes to all taxize users and contributors. It’s awesome to see how useful taxize has been through the years, and we look forward to making it even better moving forward.
Filed under
Suggest an edit
Open a pull request
